Dashboard
The Dashboard provides a summarized view of key business metrics and operational data to help vendors monitor performance efficiently. It combines visual components like charts, graphs, and tables for easier analysis and decision-making.
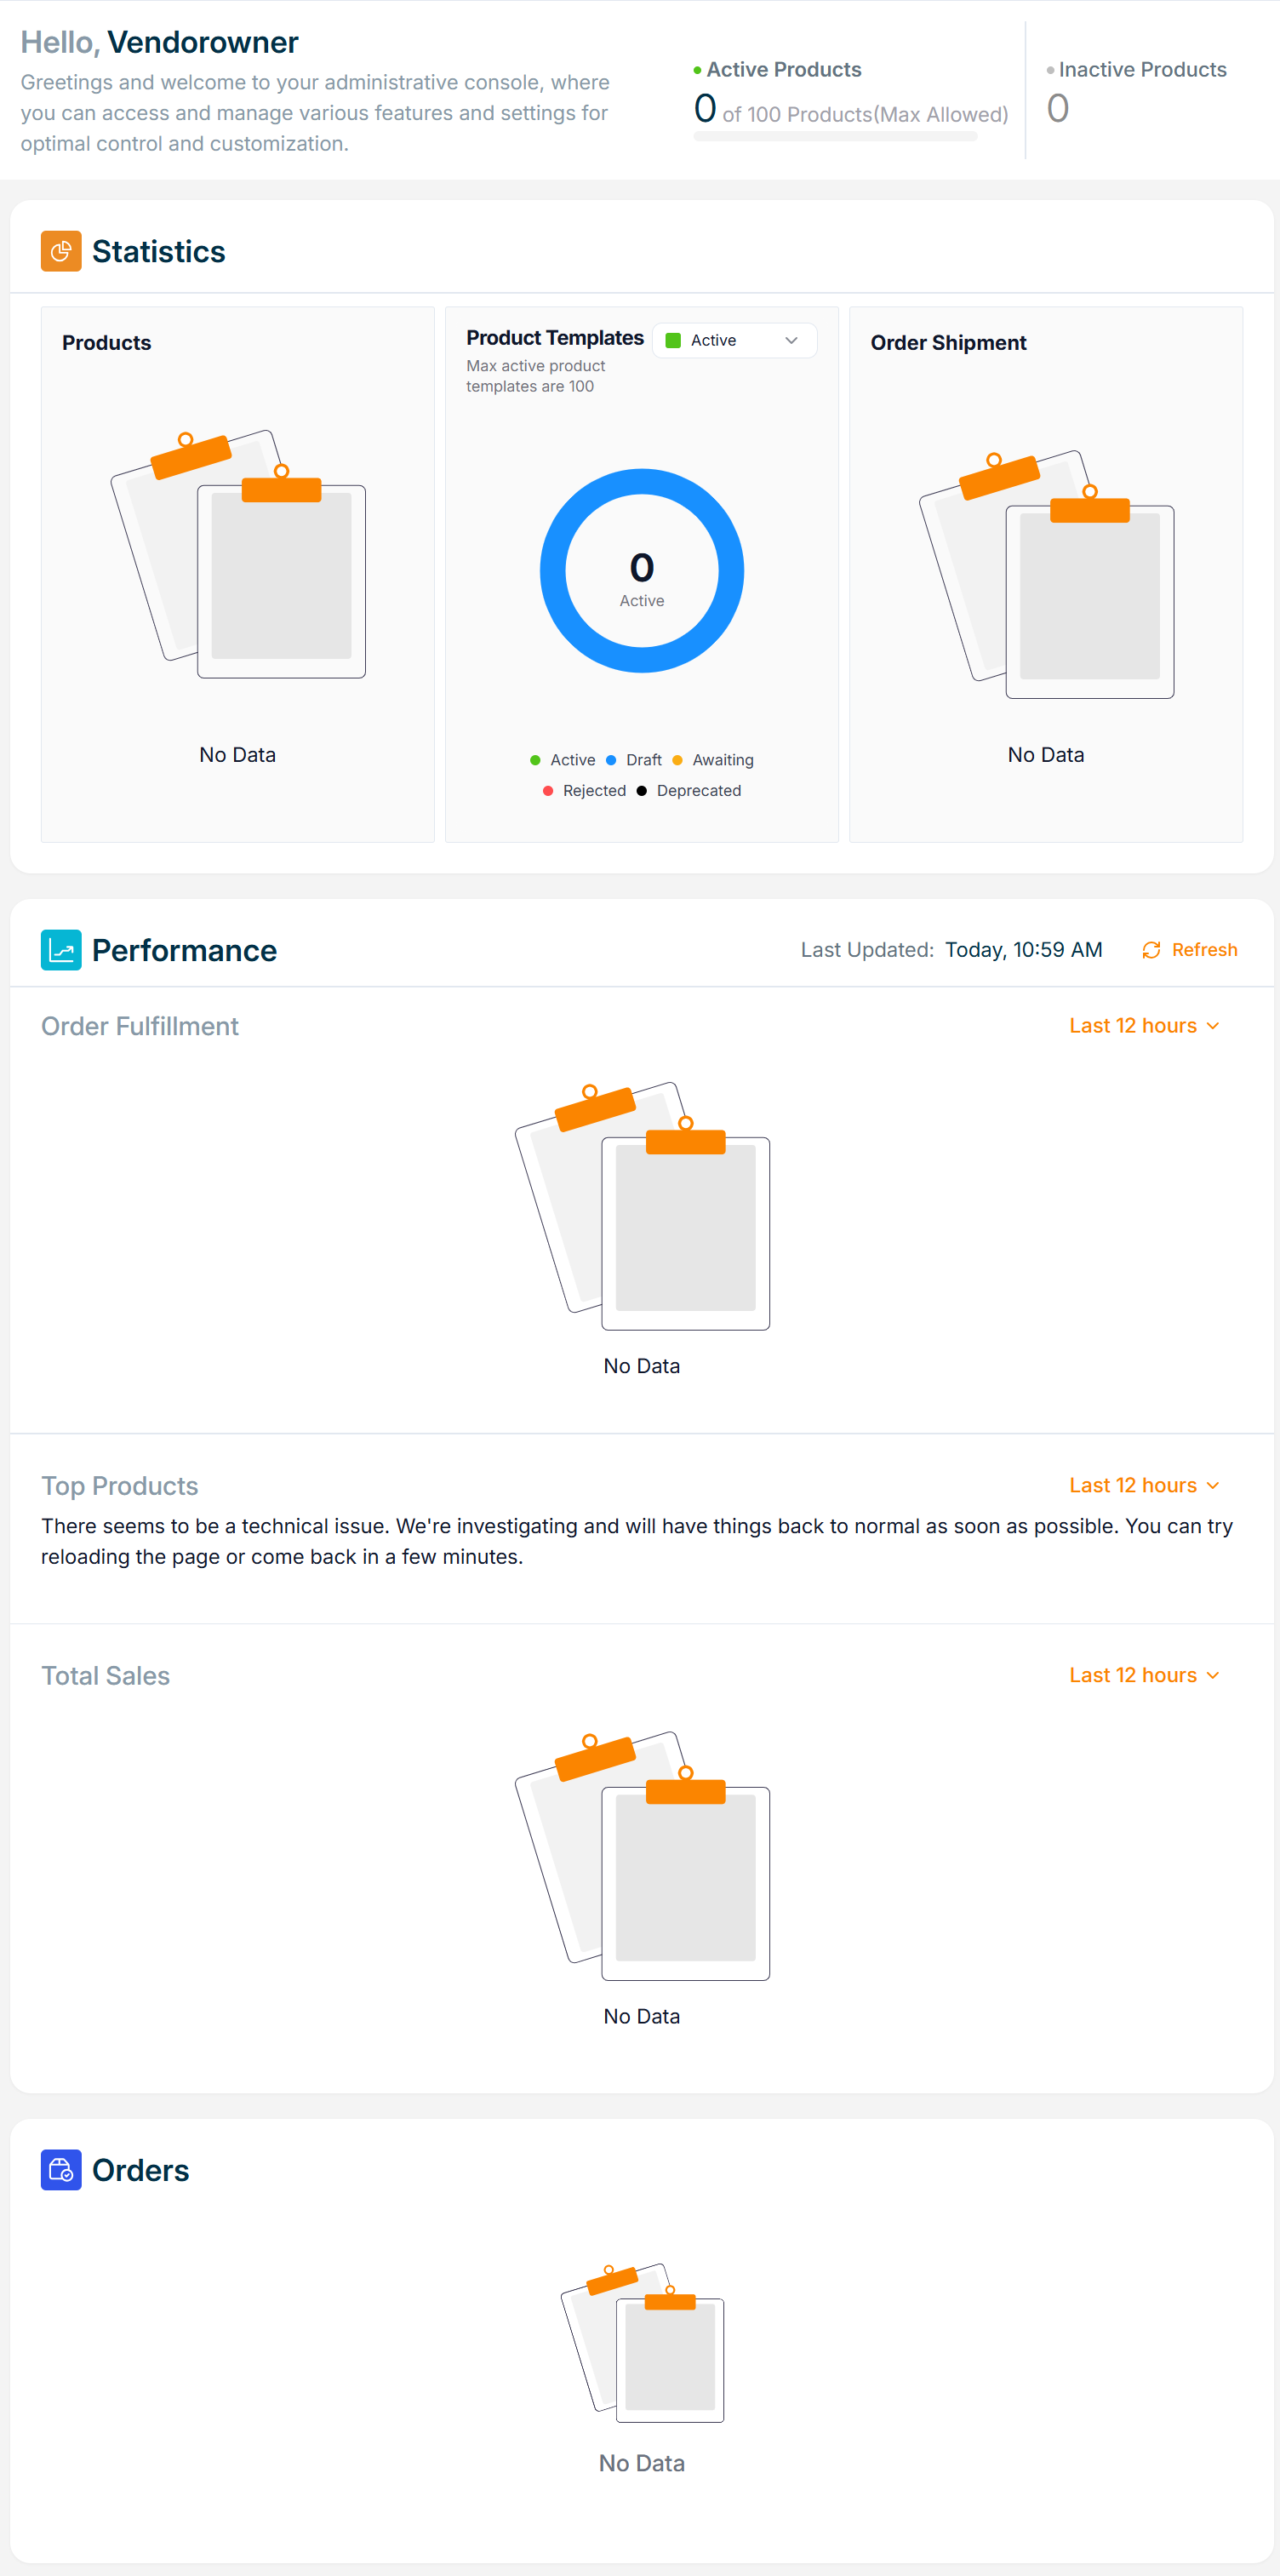
📌 Example: The screenshot above shows a vendor account where the maximum allowed published products are 100, and currently, none are active.
Click Refresh to update the dashboard with the latest data.
1. Statistics Section
Displays a quick summary of key counts relevant to vendor operations.
a. Active Products
- Indicates the total number of products currently published.
- Maximum limit is 100.
- Status breakdown includes:
- Draft
- Awaiting
- Rejected
- Unpublished
These statuses are displayed in a circular graph format for easy comparison.
b. Active Product Templates
- Shows the number of active product templates used.
- Maximum allowed templates: 100.
- Status categories include:
- Draft
- Awaiting
- Rejected
- Deprecated
A donut chart visually represents the status distribution.
c. Order Shipment
- Displays the total number of shipped orders.
- Includes a visual summary of:
- Fulfilled
- In Progress
- Returned orders.
2. Performance Section
This section gives performance insights over a selected time range (e.g., last 12 hours, last 4 weeks).
a. Order Fulfillment
- Displays a chart of:
- Number of fulfilled orders.
- Number of received orders.
- Select a time range from the dropdown to adjust the data view.
b. Top Products
- The Top Products displays the top 3 selling products for the selected time period.
- For example, if you select "Last 4 weeks" from the dropdown, a chart will show the top 3 products for each week within that time range.
c. Total Sales
- Shows Total Revenue and Total Commission over a time range.
- Presented in graphical form to easily compare trends across weeks or days.
3. Orders Section
Provides a quick view of the most recent five orders, including:
- Order Date
- Line Item ID
- Customer Name
- Order Amount
- Order Status
- Payment Type
Use this section for quick order tracking and operational overview.